Jun Zeng

Hi, I'm Jun.

Doctoral candidate

Molecular Genetics and Microbiology

David Lab • Duke University

About Me

I am a doctoral candidate in Dr. Lawrence David's laboratory in the Department of Molecular Genetics and Microbiology at Duke University. As a microbiologist, I am very interested in microbial interactions, both at the cellular level and within complex microbial ecosystems. My research has taken me through investigations of how bacteria kill one another and how dietary patterns influence the bacteria living in our gut. Over the past nine years, I have dedicated approximately 60% of my time to wet-lab experiments and 40% to computational data analysis and visualization.

I am also exploring how the integration of tools such as AI agents, MCPs, automation workflows, and vibe coding could streamline my project management and data analysis. I view AI tools as accelerators of learning and efficiency in research, though I do not support or utilize generative art. All figures and diagrams in my work are created by me manually using R or BioRender.

You can reach out to me via email or LinkedIn. A complete list of my publications is available on Google Scholar, and the code supporting my analyses and visualizations can be found on GitHub.

Introduction

My Research

My research revolves around two central questions: 1) how microbes interact with the different aspects of their environment, and 2) how we can exploit these interactions to improve human health. Over the past nine years, I have been chasing answers to these questions—and here's what I've found, so far:

DNA in our poop can tell us how microbes in our gut interacted with the foods we ate—maybe years ago.

Research Step 1
Research Step 2
Research Step 3
Research Step 4
Research Step 5

Bacteria produce and deploy molecular weapons to assassinate competitors and secure resources.

Research Step 1
Research Step 2
Research Step 3
Research Step 4
Research Step 5

My Skills

My experiences have provided me with a broad range of both experimental (wet lab) and computational (dry lab) skills, a list of which is provided on the right. Skills or tools that I used but did not end up in published works are indicated in light gray.

Wet Lab Skills +
Molecular Biology & Genetics +
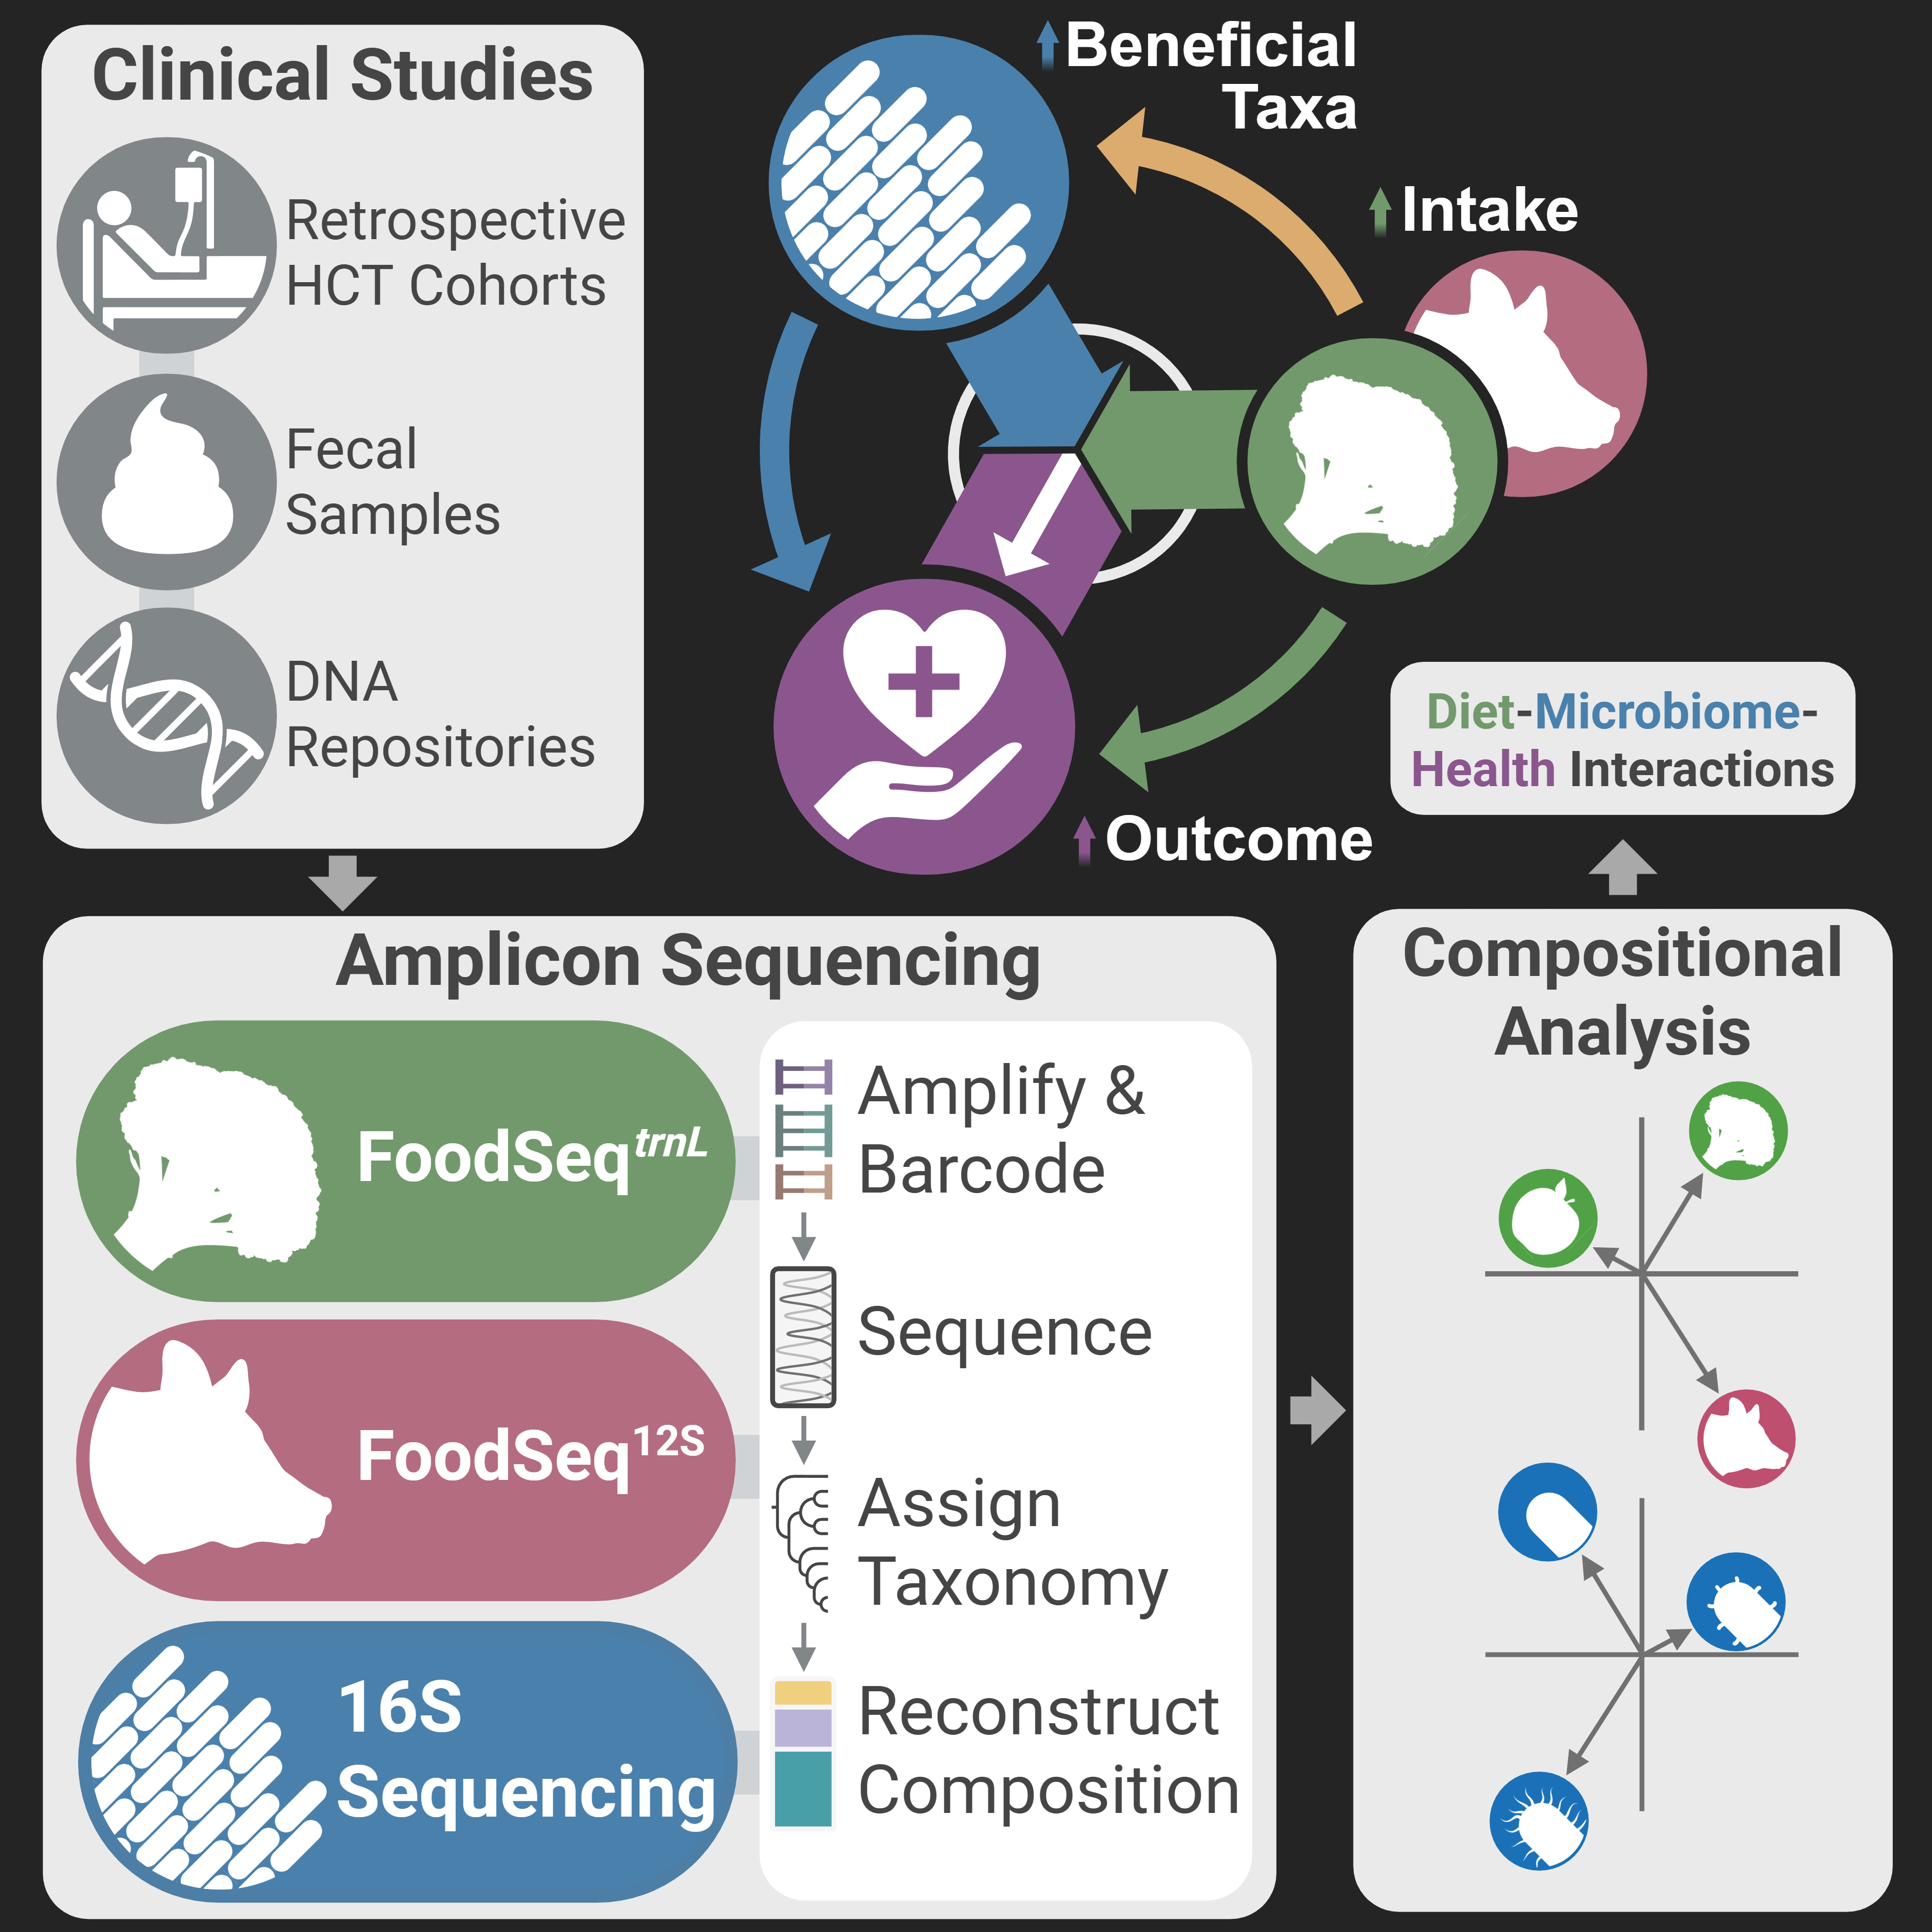
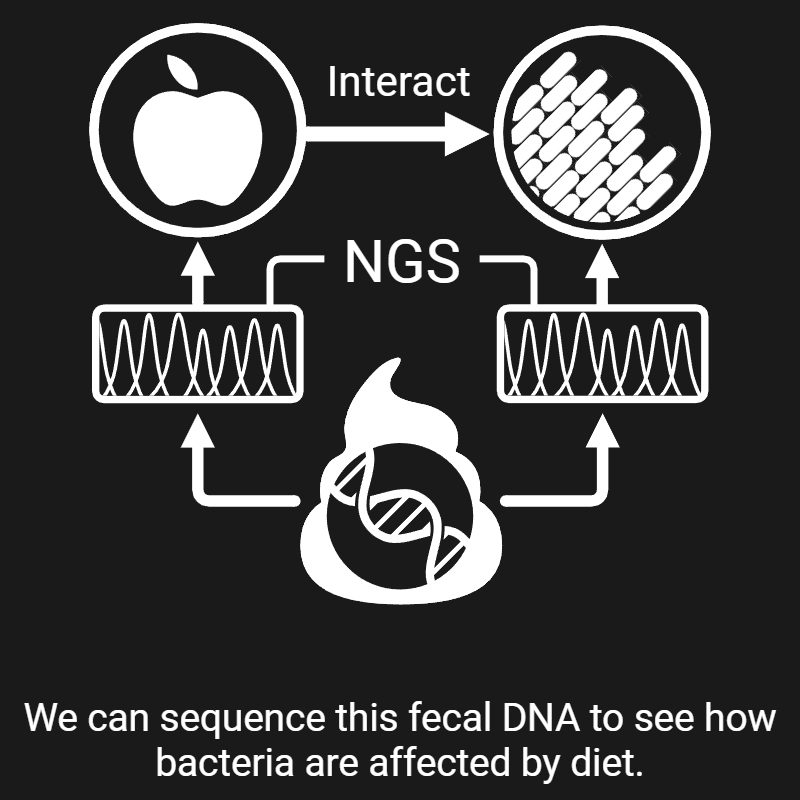
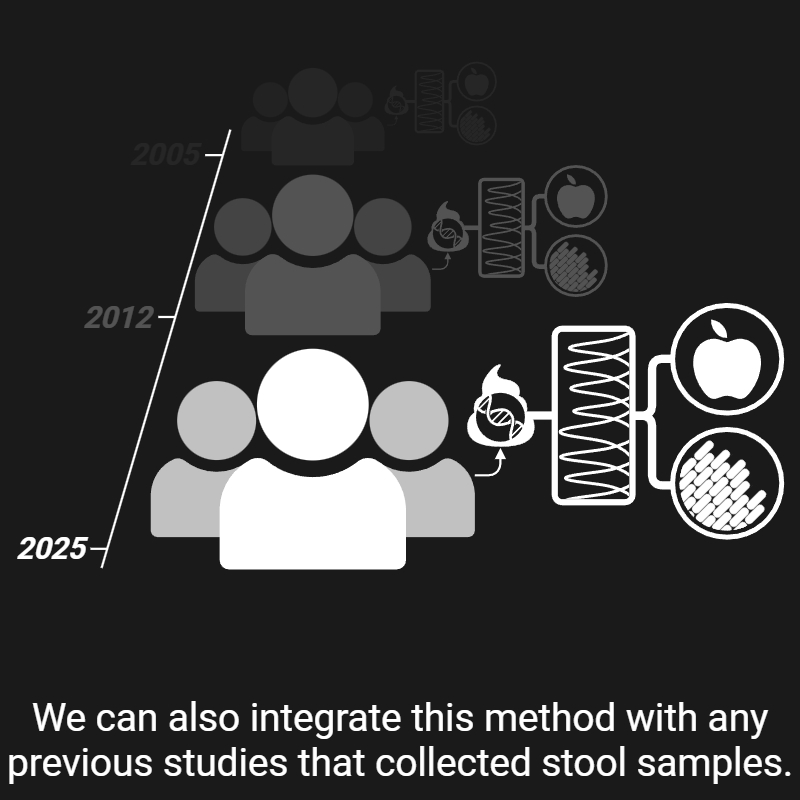
Next-generation sequencing (NGS) +
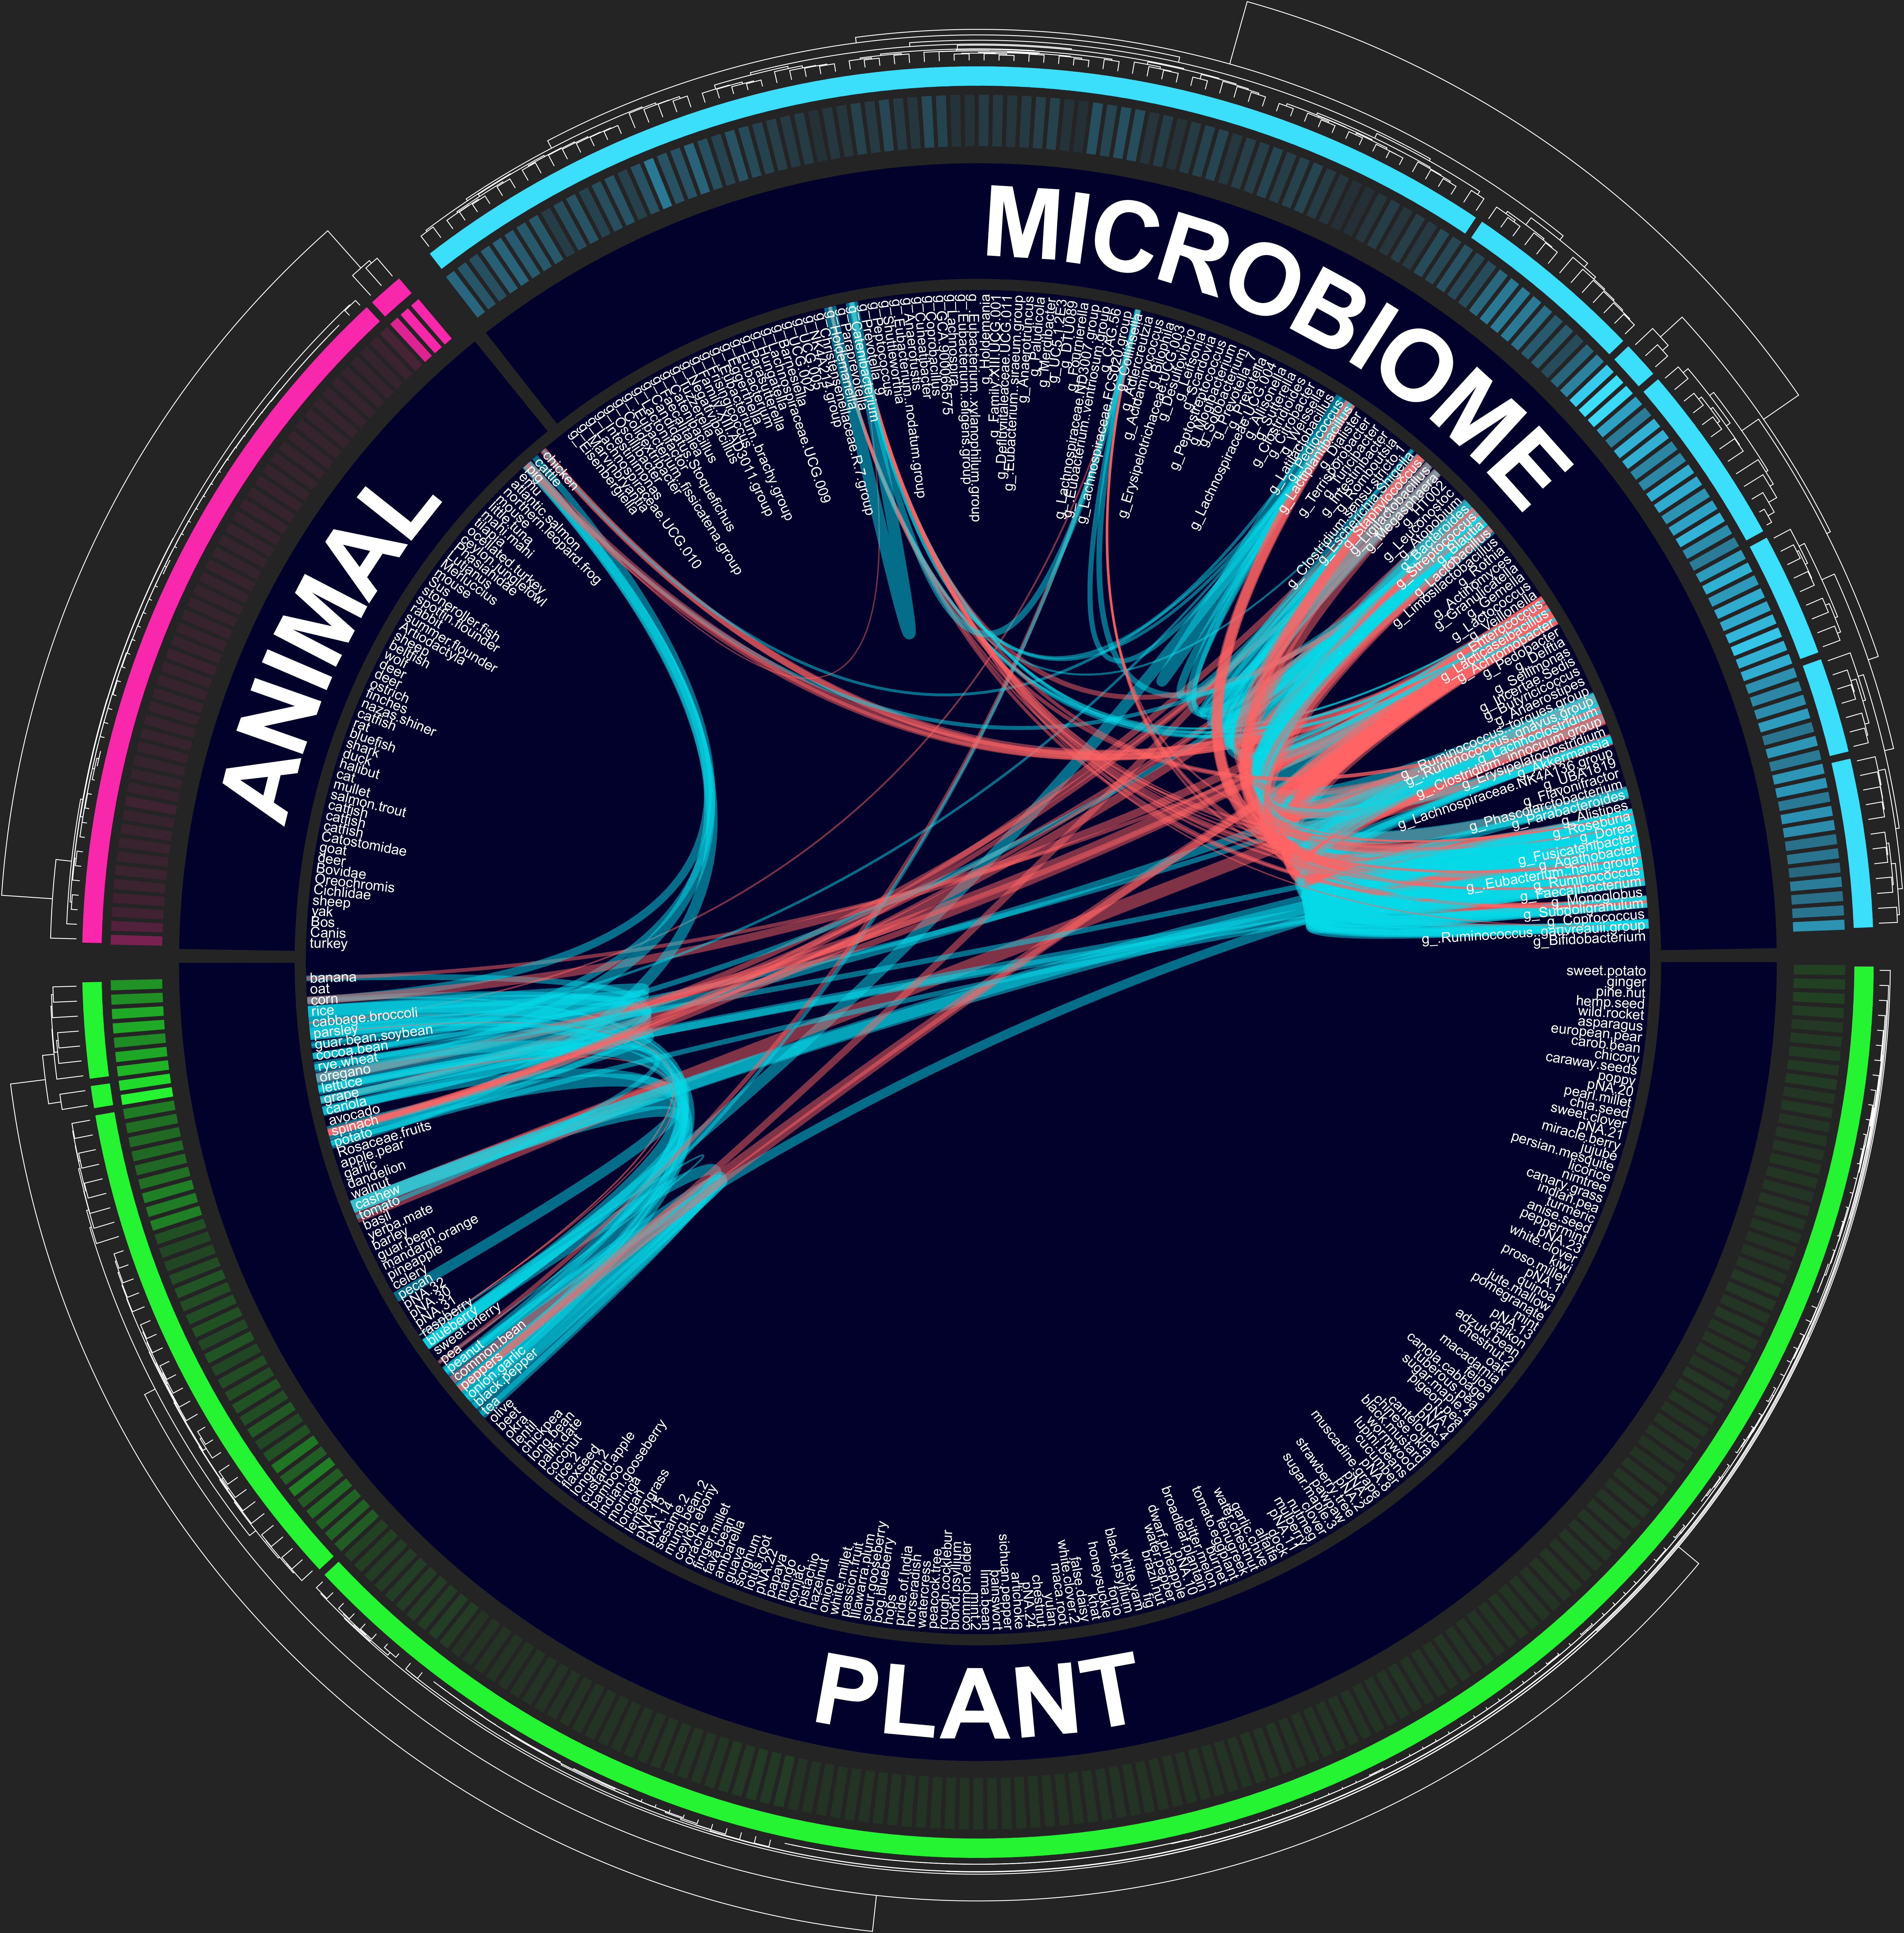
Bacterial 16S
Plant trnL
Animal 12S
Sequencing library construction
Molecular cloning +
Overlap extension PCR
Restriction digest
λ-Red recombination
Gibson assembly
Di-/tri-parental conjugation
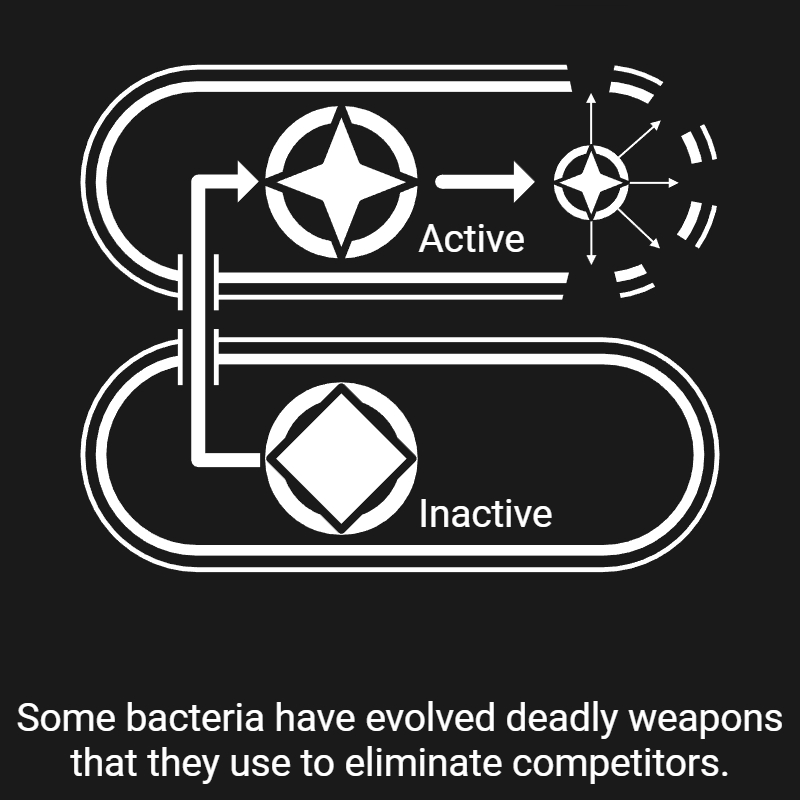
Bacterial mutagenesis
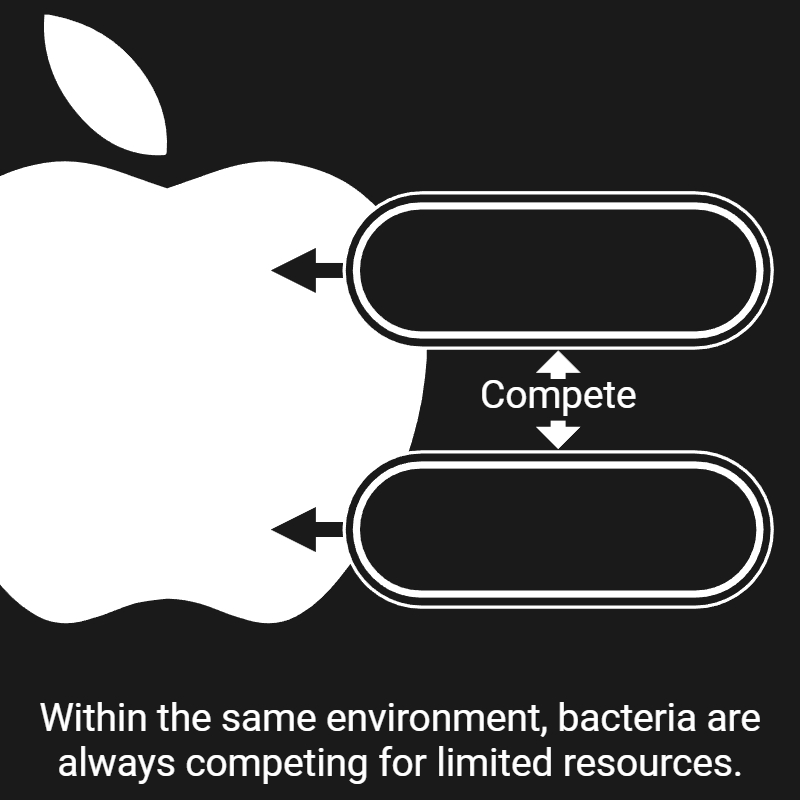
Bacterial competition
DNA extraction
PCR/qPCR
Plasmid design
Primer design
Protein Biochemistry +
Immobilized metal affinity chromatography
Protein expression
SDS-PAGE
ELISA
Automation & Instruments +
MiniSeq (Illumina)
Anaerobic chamber (Coy)
GC-FID (Agilent)
HPAE (Agilent)
Lyophilization (Labconco)
Automatic liquid handling (epMotion)
Dry Lab Skills +
Languages +
R
Bash
Statistical Analysis +
Linear mixed-effects models (LMM)
Generalized linear models (GLM)
Principal component analysis (PCA)
Hierarchical clustering
Dynamic time warping clustering
RandomForest
Bioinformatics +
Multiple sequence alignment
Phylogenetic tree construction
Conserved domain search
NCBI BLAST suite
EFI-EST
HMMER
AI Platforms & Other Tools +
Local AI deployment (LM Studio)
Claude Code (VS Code)
RStudio
Geneious
GraphPad Prism
AlphaFold/ColabFold
AlphaFold-multimer
PyMOL
GitHub
BioRender
Adobe Photoshop
Adobe Illustrator
MS Office suite
R Packages +
Data Processing +
tidyverse
microbiome
phyloseq
vegan
Statistical Analysis +
dtwclust
lmerTest
survival
pROC
Visualization & Figure Assembly +
ggplot2
ggpubr
cowplot
ggrepel
ggarchery
ggdendro
ComplexHeatmap
circlize
corrplot
dendextend
magick
gridGraphics

Publications

1.

Zeng J., García-González A. P., Epstein P., Bauer A. E., Jiang S., Kirtley M. C., Neubert B. C., Rivera C. N., Bergens M. A., Bush A. T., Hill L., Gauthier J., McGriff C., Tang H., Andermann T. M., Jobin C., Chao N. J., Dahl W. J., Wingard J. R., Sung A. D., & David L. A. (2025). Dietary signatures from fecal DNA predict hematopoietic stem cell transplantation outcomes. Submitted.

2.

Aqeel A., Kay M. C., Zeng J., Petrone B. L., Yang C., Truong T., Brown C. B., Jiang S., Carrion V. M., Bryant S., Kirtley M. C., Neshteruk C. D., Armstrong S. C., & David L. A. (2025). Grocery intervention and DNA-based assessment to improve diet quality in pediatric obesity: a pilot randomized controlled study. Obesity (Silver Spring, Md.), 33(2), 331–345. [Link]

3.

Letourneau J., Carrion V. M., Zeng J., Jiang S., Osborne O. W., Holmes Z. C., Fox A., Epstein P., Tan C. Y., Kirtley M., Surana N. K., & David L. A. (2024). Interplay between particle size and microbial ecology in the gut microbiome. The ISME journal, 18(1), wrae168. [Link]

4.

de Moraes M. H., Hsu F., Huang D., Bosch D. E., Zeng J., Radey M. C., Simon N., Ledvina H. E., Frick J. P., Wiggins P. A., Peterson S. B., & Mougous J. D. (2021). An interbacterial DNA deaminase toxin directly mutagenizes surviving target populations. eLife, 10, e62967. [Link]

5.

Mok B. Y., de Moraes M. H., Zeng J., Bosch D. E., Kotrys A. V., Raguram A., Hsu F., Radey M. C., Peterson S. B., Mootha V. K., Mougous J. D., & Liu D. R. (2020). A bacterial cytidine deaminase toxin enables CRISPR-free mitochondrial base editing. Nature, 583(7817), 631–637. [Link]

Visualizations

Some examples of plots I made for my published works.

Graphical abstract of thesis project

Dietary DNA sinagures in stool inform HCT outcomes.

Graphical summary of my thesis project, which integrate our findings from amplicon sequencing of plant trnL, animal 12S, and bacterial 16S markers--all from the same DNA extracts originated from only 15 mg of the origial fecal materials.

FoodSeq compositions of HCT patients partitioned by time relative to transplant.

Each data point is a fecal sample colored by week of sample collection relative to HCT. Double click on keys in the legend to filter samples.

Microbiome composition dominated by Blautia

Microbiomes of HCT patients in this study were frequently domianted by Blautia.

Each bar is microbiome composition of a stool sample, derived from 16S rRNA sequencing. Yellow indicates Blautia, red indicates non-Blautia species present at ≥30% relative abundance, and green indicates species present at <30% relative abundance.

Hierarchical clustering heatmap

Hierarchical clustering of bacterial taxa further highlight microbiome domination.

A heatmap displaying a Euclidean distance matrix based on bacterial abundance. Red indicates lower distances, whereas cyan represents higher distances. The three dominant microbiome taxa showed negative associations with almost all other microbial groups.

Circos plot showing associations

All significant pair-wise associations between plant, animal, and bacterial taxa.

Associations are more apparent between food taxa or between bacterial taxa, while inter-dataset associations are rare. This is likely due to the fact that diet is more transient and dynamic, while bacterial compositions could be stable over longer periods of time.